Struggling to grasp the true scale of solar energy? The numbers seem huge, but it's hard to picture what they mean. You need clear, simple answers to understand their real-world impact.
A utility-scale solar farm1's output depends on its size, location, and technology. A typical 1-megawatt (MW)2 farm can produce 1.5 to 2.5 million kilowatt-hours (kWh)3 per year, enough electricity to power between 150 and 250 average American homes for a year.
It’s easy to hear about massive solar projects and wonder what they actually accomplish. We see headlines about gigawatt-sized farms, but these numbers don't mean much without context. I get it. When I first started sourcing components for energy projects, I had the same questions. Let's break down these figures into something more understandable. We'll explore exactly how much electricity these giant power plants generate and what that means for the communities they serve.
How Large Is a Typical Utility-Scale Solar Farm?
Wondering what separates a big rooftop system from a real power plant? The term "utility-scale" can be confusing. You need a clear definition to understand the industry's benchmarks and project sizes.
A utility-scale solar farm1 is generally defined as a project with a capacity of 5 megawatts (MW) or more. These large-scale facilities are designed specifically to generate electricity and sell it directly to the power grid, supplying energy for entire communities and regions.
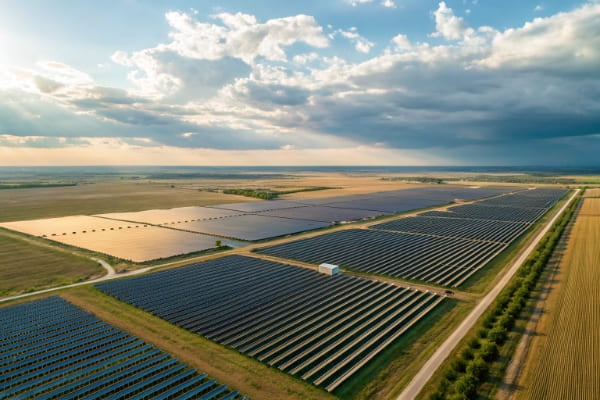
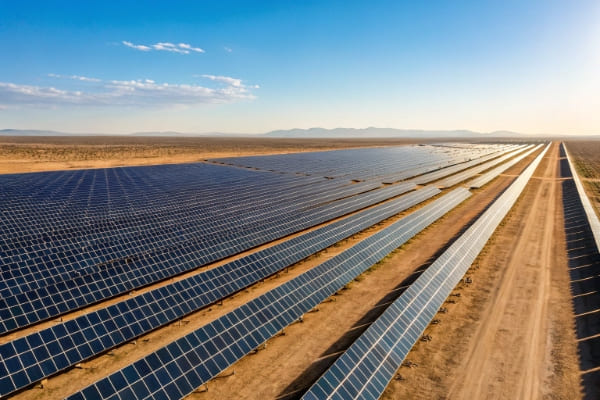
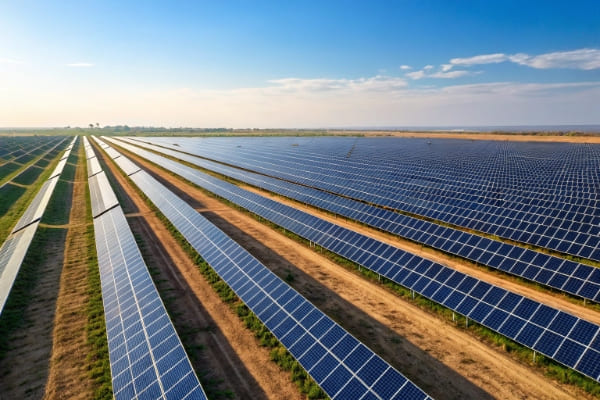
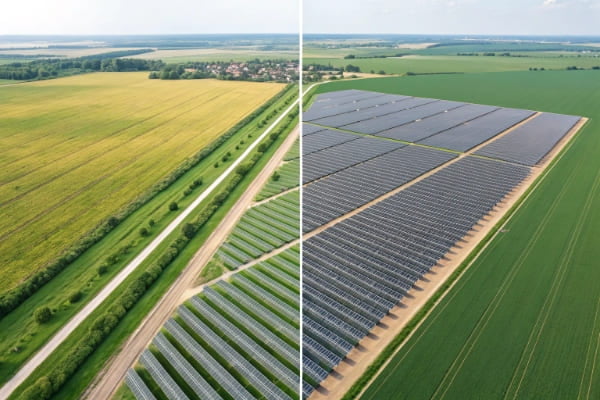
When we talk about solar farms, size really matters. A small commercial project might cover a large roof, but a utility-scale project is on a completely different level. These are true power stations. The 5 MW threshold is a common starting point, but many modern farms are much, much larger. We often see projects in the 100 MW to 500 MW range. The world's largest solar parks4, like the Midong Solar Park in China, are pushing into the multi-gigawatt (GW) scale. For context, 1 GW equals 1,000 MW. These massive installations can cover thousands of acres of land. The physical footprint is directly tied to the power output, as more land allows for more panels to capture more sunlight. So, when you hear "utility-scale," think big—think power for cities, not just a few buildings.
How Many Homes Can a Solar Farm Power?
You see massive fields of solar panels, but what does that mean for you? It's hard to connect megawatts to actual households. You want to know the direct impact on everyday life.
A 1 MW solar farm can power between 150 and 250 homes annually. Scaling this up, a 100 MW farm can serve 15,000 to 25,000 homes, and a massive 1 GW (1,000 MW) facility can power hundreds of thousands of households.
Let's make these numbers more concrete. The connection between a solar farm's capacity and the number of homes it can power is a great way to understand its impact. The calculation depends on the average electricity consumption5 of a home, which varies by country. In the U.S., an average home uses about 10,600 kWh per year. A 1 MW solar farm that produces 2 million kWh annually can therefore power roughly 188 homes (2,000,000 kWh / 10,600 kWh/home). Using this logic, we can see how quickly the impact grows with the size of the farm. A large-scale 500 MW project could power nearly 100,000 homes. This shows how utility-scale solar is a powerful tool for transitioning entire communities to renewable energy6, moving far beyond individual rooftop solutions to provide clean power at a city-wide level.
How Much Energy Does a 50 MW or 100 MW Solar Farm Generate?
The terms "50 MW" or "100 MW" sound impressive, but what do they mean for annual energy output? These capacity ratings are a starting point. You need to know the actual electricity produced over a year.
A 50 MW solar farm typically generates between 75 and 125 million kWh of electricity per year. A 100 MW solar farm doubles that, producing between 150 and 250 million kWh annually, depending on local climate and technology used.
A solar farm's "megawatt" rating is its nameplate capacity. This is the maximum power it can produce at any single moment under ideal test conditions. However, the sun isn't always shining perfectly. The more useful number is the total energy generated over a year, measured in kilowatt-hours (kWh)3 or megawatt-hours (MWh). Based on my experience with project components, a simple rule of thumb is to multiply the capacity in MW by an annual production factor. This factor often falls between 1,500 and 2,500 hours of peak equivalent production per year.
| Farm Capacity | Annual Production Factor (Hours) | Annual Energy Generation (kWh) |
|---|---|---|
| 50 MW | 1,500 - 2,500 | 75,000,000 - 125,000,000 |
| 100 MW | 1,500 - 2,500 | 150,000,000 - 250,000,000 |
| 1 GW (1,000 MW) | 1,500 - 2,500 | 1.5 billion - 2.5 billion |
This table shows why a 100 MW farm is a significant energy asset. It doesn't just produce twice the power of a 50 MW farm at peak moments; it delivers double the total energy to the grid over the entire year.
What Factors Affect Solar Farm Electricity Production?
Thinking a 100 MW farm always produces the same amount of power? That's a common mistake. Many variables can change the output. You need to know what factors influence the final energy yield.
The primary factors affecting a solar farm's production are its geographic location7 (solar irradiance8), the efficiency of its panels, the use of tracking systems9, weather patterns, and its overall capacity factor10. These elements determine the actual energy output versus its nameplate capacity.
![]()
A solar farm's performance is not set in stone. It's a dynamic system influenced by several key variables. Think of the nameplate capacity as the size of the engine, but these factors determine how fast the car actually goes. I've seen projects with identical capacities perform very differently because of these details. For example, a farm in Arizona will naturally outperform one in Germany due to more intense, consistent sunlight. Technology also plays a huge role. Using bifacial panels11, which capture light on both sides, can boost production by 10-20%. Adding dual-axis trackers that follow the sun all day can increase output by up to 25% compared to a fixed-tilt system. Finally, things like panel degradation over time, soiling from dust, and temperature all chip away at the maximum potential. Understanding these factors is critical for accurately forecasting a farm's real-world energy generation12 and financial viability.
How Efficient Are Utility-Scale Solar Panels?
Are the panels used in huge solar farms the same as on a house? You might assume they are, but the technology differs. Understanding their efficiency is key to grasping how they generate so much power.
Modern utility-scale solar panels typically have an efficiency of 20% to 23%. This means they can convert that percentage of captured sunlight directly into electrical energy. Advanced technologies like bifacial panels11 and PERC cells13 push these efficiency ratings even higher.
Panel efficiency is a measure of how well a solar panel converts sunlight into usable electricity. While a 20-23% rate might not sound high, it's a huge leap from where the technology was a decade ago. In utility-scale projects, even a small 1% increase in efficiency makes a massive difference across thousands of panels. Project developers focus heavily on this metric because it directly impacts the land area needed and the overall cost of energy. In my work sourcing components, I've seen a clear shift toward higher-efficiency products like PERC (Passivated Emitter and Rear Cell) and bifacial panels11. Bifacial panels are especially interesting for large farms. They not only capture direct sunlight on the front but also reflected light from the ground on the back, increasing total energy yield by 10% or more without using more space. This constant push for better efficiency is what makes solar power increasingly competitive with traditional energy sources.
How Does Location Impact Solar Power Output?
Does a solar farm in cloudy London produce as much as one in sunny Madrid? Absolutely not. Location is the single biggest factor. You need to understand how geography dictates a farm's potential.
Location determines the amount of solar irradiance8—or sunlight intensity—a farm receives. A site in a high-irradiance region like the Southwestern U.S. can produce over 2,000 kWh per kilowatt-peak (kWp) installed, while a site in Northern Europe might only generate 1,000 kWh per kWp.
When developers plan a solar farm, the first thing they look at is a solar irradiance8 map. This tells them how much solar energy hits a specific area over a year. It's the most critical variable for predicting output. A farm's success is fundamentally tied to the quality of its "fuel"—sunlight. For example, a 100 MW farm in Arizona will generate far more electricity than an identical 100 MW farm in Seattle. The difference isn't due to better technology but simply more and stronger sun. This is why you see the world's largest solar projects concentrated in deserts and sunny regions like the Middle East, Australia, China, and the American Southwest. This geographic dependency also explains why some regions rely more on other renewables, like wind or hydro, to complement their energy mix. A great location can make an average project highly profitable, while a poor location can doom even the most advanced one.
What Is the Capacity Factor of a Solar Power Plant?
You've heard the term "capacity factor10," but what does it really mean for a solar farm? It sounds technical, but it's a simple, crucial metric. It helps you understand a plant's real-world performance.
The capacity factor10 is the ratio of a solar farm's actual annual energy output compared to its maximum possible output if it ran at full nameplate capacity 24/7. For utility-scale solar, this typically ranges from 20% to 25%, but can exceed 30% in prime locations.

The capacity factor10 cuts through the hype of nameplate ratings. A 100 MW solar farm can't run at 100 MW all day and night because the sun goes down. The capacity factor10 tells you how much power it actually produces over a full year. Here’s a simple breakdown: a 100 MW plant has a maximum theoretical output of 876,000 MWh per year (100 MW x 24 hours x 365 days). If its capacity factor10 is 25%, its actual annual output is 219,000 MWh (876,000 MWh x 0.25). This number is far more realistic and useful for planning. From a sourcing perspective, I know that technologies like dual-axis trackers and energy storage systems14 are specifically designed to improve this metric. Trackers increase the time the panels face the sun directly, while batteries store excess energy for use after sunset, effectively boosting the plant's overall capacity factor10 and value to the grid.
Conclusion
Utility-scale solar farms are massive power generators. A 100 MW facility can power over 15,000 homes, but its final output depends on location, technology, and its all-important capacity factor10.
Explore this link to understand the definition and significance of utility-scale solar farms in renewable energy. ↩
Learn about megawatts and their importance in measuring solar energy capacity. ↩
Discover how kilowatt-hours are used to quantify energy production and consumption. ↩
Explore the world's largest solar parks and their contributions to renewable energy. ↩
Discover how average home electricity consumption relates to solar energy production. ↩
Learn about the significance of renewable energy in combating climate change. ↩
Understand the impact of geographic location on solar energy generation potential. ↩
Understand solar irradiance and its critical role in solar energy generation. ↩
Learn how tracking systems enhance solar panel efficiency by following the sun. ↩
Find out how capacity factor affects the efficiency and output of solar power plants. ↩
Explore the benefits of bifacial panels in enhancing solar energy production. ↩
Understand the calculations behind energy generation in solar farms. ↩
Learn about PERC technology and its impact on solar panel efficiency. ↩
Understand the role of energy storage systems in maximizing solar energy utilization. ↩